📌 Introduction to Pandas
Pandas is a fast, powerful, flexible open-source data analysis and manipulation library built on top of Python. It is designed to work with structured data like tables (Excel, CSV, SQL, etc.).
Key Features:
- Easy handling of missing data
- Automatic and explicit data alignment
- Powerful group-by functionality
- Time series functionality
Importing Pandas
import pandas as pd
Explanation: This imports pandas and assigns it the alias pd, which is a widely used convention.
🧰 Pandas Data Structures
1. Series
A Series is a one-dimensional array with labels (indexes).
Example:
import numpy as np
s = pd.Series([10, 20, np.nan, 40])
print(s)
Output:
0    10.0
1    20.0
2     NaN
3    40.0
dtype: float64
Explanation:
NaNindicates a missing value.- Index is auto-generated (0,1,2,…).
2. DataFrame
A DataFrame is a 2D labeled data structure with columns of potentially different types.
Example:
data = {
    'Name': ['Alice', 'Bob'],
    'Age': [25, 30]
}
df = pd.DataFrame(data)
print(df)
Output:
    Name  Age
0  Alice   25
1    Bob   30
Explanation:
- Dictionary keys become column names.
- Values are inserted row-wise.
💪 Basic Operations
Viewing Data
print(df.head())
print(df.tail())
Output:
    Name  Age
0  Alice   25
1    Bob   30
Explanation:
.head()shows the first 5 rows..tail()shows the last 5 rows.
Structure and Summary
print(df.shape)
print(df.columns)
print(df.dtypes)
print(df.info())
Output:
(2, 2)
Index(['Name', 'Age'], dtype='object')
Name    object
Age      int64
dtype: object
<class 'pandas.core.frame.DataFrame'>
RangeIndex: 2 entries, 0 to 1
Data columns (total 2 columns):
 #   Column  Non-Null Count  Dtype
---  ------  --------------  -----
 0   Name    2 non-null      object
 1   Age     2 non-null      int64
dtypes: int64(1), object(1)
memory usage: 160.0 bytes
Explanation:
.shapereturns dimensions..columnslists column names..dtypesshows data types..info()summarizes memory usage and null values.
🔧 Data Selection
Column Selection
print(df['Name'])
Output:
0    Alice
1      Bob
Name: Name, dtype: object
Explanation: Selects a single column as Series.
Row Selection
print(df.loc[0])
print(df.iloc[1])
Output:
Name    Alice
Age        25
Name: 0, dtype: object

Name     Bob
Age        30
Name: 1, dtype: object
Explanation:
.loc[]uses label-based indexing..iloc[]uses integer position.
🧹 Data Cleaning
Handling Missing Values
df = pd.DataFrame({'A': [1, 2, np.nan], 'B': [4, np.nan, 6]})
print(df.isnull())
print(df.fillna(0))
Output:
       A      B
0  False  False
1  False   True
2   True  False

     A    B
0  1.0  4.0
1  2.0  0.0
2  0.0  6.0
Explanation:
isnull()shows where values are missing.fillna(0)replaces all missing values with 0.
🔁 Sorting and Filtering
Sorting
print(df.sort_values(by='A'))
Explanation: Sorts the DataFrame based on column ‘A’.
Filtering
print(df[df['A'] > 1])
Explanation: Returns rows where column ‘A’ has values greater than 1.
📈 Aggregation & Statistical Functions in Pandas
Sample DataFrame
import pandas as pd

df = pd.DataFrame({
    'Employee': ['Vikram', 'Alice', 'Bob', 'John', 'Priya'],
    'Salary': [90000, 80000, 60000, 60000, 80000],
    'Experience': [5, 4, 3, 3, 4]
})
1. max() – Maximum value
print(df['Salary'].max())
Output:
90000
Explanation: Returns the highest salary in the column.
2. min() – Minimum value
print(df['Salary'].min())
Output:
60000
Explanation: Returns the lowest salary.
3. count() – Count of non-null values
print(df['Salary'].count())
Output:
5
Explanation: Counts the number of non-missing entries in the ‘Salary’ column.
4. mean() – Average value
print(df['Salary'].mean())
Output:
74000.0
Explanation: Returns the arithmetic mean of all salaries.
5. mode() – Most frequent value(s)
print(df['Salary'].mode())
Output:
0    60000
1    80000
dtype: int64
Explanation: Shows modes; both 60000 and 80000 appear twice.
6. median() – Middle value
print(df['Salary'].median())
Output:
80000.0
Explanation: Middle salary value when sorted.
7. std() – Standard deviation
print(df['Salary'].std())
Output:
13038.40481
Explanation: Measures salary variation from the mean.
8. var() – Variance
print(df['Salary'].var())
Output:
170000000.0
Explanation: Average squared deviation from the mean.
9. corr() – Correlation matrix
print(df.corr(numeric_only=True))
Output:
             Salary  Experience
Salary     1.000000    0.654654
Experience 0.654654    1.000000
Explanation: Measures how strongly salary and experience are related (1 = perfect positive).
10. cov() – Covariance matrix
print(df.cov(numeric_only=True))
Output:
           Salary  Experience
Salary     1.7e+08   65000.0
Experience 65000.0   0.5
Explanation: Shows how salary and experience vary together.
📆 Working with Dates
dates = pd.date_range('2023-01-01', periods=3)
df = pd.DataFrame({'Date': dates, 'Visitors': [100, 200, 300]})
df['Day'] = df['Date'].dt.day_name()
print(df)
Output:
        Date  Visitors      Day
0 2023-01-01       100    Sunday
1 2023-01-02       200    Monday
2 2023-01-03       300   Tuesday
Explanation:
- Generates a range of dates and adds a column for day names.
🔀 Merging and Joining
founders = pd.DataFrame({
    'Company': ['Itxperts', 'TechNova'],
    'Founder': ['Vikram Singh Rawat', 'Sara Khan']
})

revenue = pd.DataFrame({
    'Company': ['Itxperts', 'TechNova'],
    'Revenue': [5000000, 3000000]
})

result = pd.merge(founders, revenue, on='Company')
print(result)
Output:
   Company            Founder  Revenue
0  Itxperts  Vikram Singh Rawat  5000000
1  TechNova            Sara Khan  3000000
Explanation: Merges two DataFrames using the common column ‘Company’.
🔃 Pivot Tables
data = pd.DataFrame({
    'Company': ['Itxperts', 'Itxperts', 'TechNova', 'TechNova'],
    'Quarter': ['Q1', 'Q2', 'Q1', 'Q2'],
    'Profit': [120000, 150000, 100000, 110000]
})

pivot = data.pivot_table(values='Profit', index='Company', columns='Quarter')
print(pivot)
Output:
Quarter      Q1      Q2
Company
Itxperts  120000  150000
TechNova  100000  110000
Explanation: Creates a pivot table showing profits by quarter for each company.
📊 Data Visualization (Requires matplotlib)
import matplotlib.pyplot as plt

sales = pd.DataFrame({
    'Month': ['Jan', 'Feb', 'Mar'],
    'Itxperts': [30000, 35000, 40000]
})

sales.plot(x='Month', y='Itxperts', kind='bar', title='Itxperts Monthly Sales')
plt.ylabel('Revenue')
plt.show()
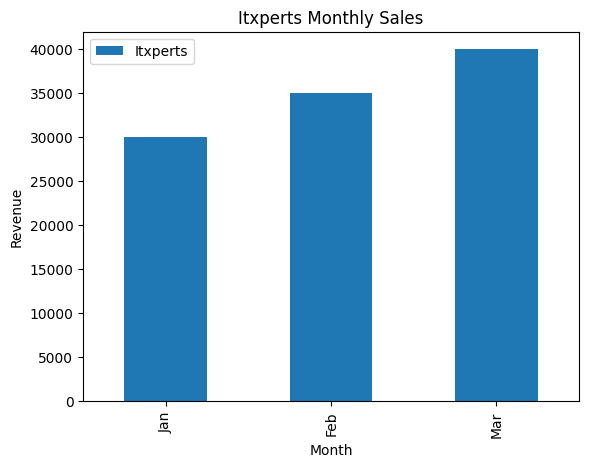
Explanation: Plots a bar chart of monthly revenue for Itxperts.
📝 Practice Questions and Answers
Q1. Create a DataFrame for 5 employees of Itxperts with columns: Name, Age, Department, and Salary.
df = pd.DataFrame({
    'Name': ['Vikram Singh Rawat', 'Alice', 'Bob', 'John', 'Priya'],
    'Age': [35, 30, 28, 25, 26],
    'Department': ['Development', 'HR', 'Sales', 'Development', 'HR'],
    'Salary': [90000, 70000, 60000, 75000, 72000]
})
print(df)
Q2. Filter employees who earn more than ₹70,000.
print(df[df['Salary'] > 70000])
Q3. Find the average salary of employees in each department.
print(df.groupby('Department')['Salary'].mean())
Q4. Find the maximum and minimum salaries.
print("Max Salary:", df['Salary'].max())
print("Min Salary:", df['Salary'].min())
Q5. Find the most common (mode) salary.
print(df['Salary'].mode())
Q6. Get a statistical summary of all numeric columns.
print(df.describe())
Q7. Add a new column “Experience” and calculate correlation between Salary and Experience.
df['Experience'] = [10, 7, 5, 6, 8]
print(df[['Salary', 'Experience']].corr())
Q8. Sort the DataFrame by Salary in descending order.
print(df.sort_values(by='Salary', ascending=False))
Q9. Replace department “HR” with “Human Resources”.
df['Department'] = df['Department'].replace('HR', 'Human Resources')
print(df)
Q10. Save the DataFrame to a CSV file named “itxperts_employees.csv” without index.
df.to_csv("itxperts_employees.csv", index=False)
🎯 MCQs on Pandas
Q1. Which of the following is NOT a core data structure in pandas?
A. Series
B. DataFrame
C. Array
D. Panel
✅ Answer: C. Array
Q2. What function is used to read a CSV file in pandas?
A. read_table()
B. read_file()
C. read_csv()
D. open_csv()
✅ Answer: C. read_csv()
Q3. Which function returns the number of non-null values in a DataFrame column?
A. sum()
B. count()
C. len()
D. value_counts()
✅ Answer: B. count()
Q4. What does the describe() function do?
A. Shows null values
B. Sorts the data
C. Provides summary statistics
D. Removes duplicates
✅ Answer: C. Provides summary statistics
Q5. Which of the following is used to calculate correlation between two columns?
A. .cov()
B. .corr()
C. .mean()
D. .std()
✅ Answer: B. .corr()
🧪 Mini Project: Itxperts Performance Analysis
Step 1: Create DataFrame
df = pd.DataFrame({
    'Name': ['Vikram', 'Alice', 'Bob', 'John', 'Priya'],
    'Department': ['AI/ML', 'Web', 'Sales', 'Web', 'HR'],
    'Score': [92, 88, 75, 80, 70],
    'Experience': [10, 7, 5, 6, 4]
})
Step 2: Find department-wise average score
print(df.groupby('Department')['Score'].mean())
Step 3: Add a column for performance rating
def get_rating(score):
    if score >= 90:
        return 'Excellent'
    elif score >= 80:
        return 'Good'
    elif score >= 70:
        return 'Average'
    else:
        return 'Needs Improvement'

df['Rating'] = df['Score'].apply(get_rating)
print(df)
Step 4: Export top performers (score > 85)
top_performers = df[df['Score'] > 85]
top_performers.to_csv('top_performers.csv', index=False)
Important Pandas Questions for CBSE Class 12 Board Exams
50 Important Questions on Pandas (Python – Data Handling using Pandas) that can be asked in CBSE Class 12 Informatics Practices / Computer Science Board Exams – covering 1-mark, 2-mark, and 3/4-mark types:
✅ 1-Mark Questions (Definition / MCQ Type)
- What is Pandas in Python?
- What are the two main data structures of Pandas?
- What is a Series in Pandas?
- What is a DataFrame?
- Which method is used to read a CSV file in Pandas?
- Which method returns the first 5 rows of a DataFrame?
- Which attribute returns the number of rows and columns in a DataFrame?
- Which function gives the statistical summary of a DataFrame?
- What is the default indexing in a Pandas Series?
- What does
df.dtypesreturn? - Which function is used to write a DataFrame into a CSV file?
- What is the difference between
loc[]andiloc[]? - Which function is used to find null values in a DataFrame?
- Which Pandas function is used to find the correlation between columns?
- What is the output type of
df['ColumnName']?
✅ 2-Mark Questions (Short Answer)
- Write two differences between Series and DataFrame.
- How is missing data represented in Pandas?
- How can you rename a column in a DataFrame?
- What is the use of
dropna()andfillna()in Pandas? - Write a statement to sort a DataFrame by the column “Age” in descending order.
- How can you filter rows where salary is more than ₹50,000?
- Write a code to create a Series from a dictionary.
- Write a Python statement to calculate the mean of column “Marks”.
- Write a code to read an Excel file using Pandas.
- What is the purpose of the
groupby()function?
✅ 3/4-Mark Questions (Application-Based / Coding)
- Write a Python program to create a DataFrame with columns: Name, Age, and Marks.
- Write code to:
- Read a CSV file named
students.csv - Display first 3 rows
- Write a code to drop the column “Email” from the DataFrame
df. - Given a DataFrame
df, write a code to count total null values in each column. - Create a DataFrame of 3 students and add a new column “Result” based on Marks.
- Write a code to sort a DataFrame first by “Class” and then by “Marks”.
- Create a Series of your 5 favorite fruits and print the first and last two elements.
- How can you perform aggregation to find total salary department-wise?
- Write a code to merge two DataFrames
df1anddf2based on “EmpID”. - How is
value_counts()useful in analyzing data?
✅ Case-Based / Real Application Questions
- Create a DataFrame of ITxperts employees with name, department, and experience. Display those with more than 5 years of experience.
- From a CSV file “sales.csv”, read the data and show maximum, minimum, and average monthly sales.
- Write a code to replace all NaN values in the “Marks” column with 0.
- Explain the use of
apply()function with an example. - Write a Python function to classify students as “Pass” or “Fail” based on Marks using
apply().
✅ Output Prediction / Error Finding
- Predict the output of:
import pandas as pd
s = pd.Series([10, 20, 30], index=['a', 'b', 'c'])
print(s['b'])
- Predict the output of:
df = pd.DataFrame({'X': [1, 2], 'Y': [3, 4]})
print(df.loc[1])
- Find the error:
df = pd.DataFrame()
print(df.head(10))
df.sort('Salary')
- What will be the output if:
df = pd.DataFrame({'A': [1, 2, 3], 'B': [4, 5, 6]})
print(df.mean())
- What will
df.describe(include='all')return?
✅ Conceptual / Reasoning-Based
- Why is Pandas preferred for data analysis in Python?
- What happens if the index values in a Series are not unique?
- Differentiate between
append()andconcat()in Pandas. - Can a DataFrame have columns of different data types? Justify.
- How is Pandas useful for handling real-world tabular data?