Sample Papers •
Oct 6, 2025
Browse archive
Part 1: Foundational Concepts 1. What is Pandas? An open-source Python library used for...
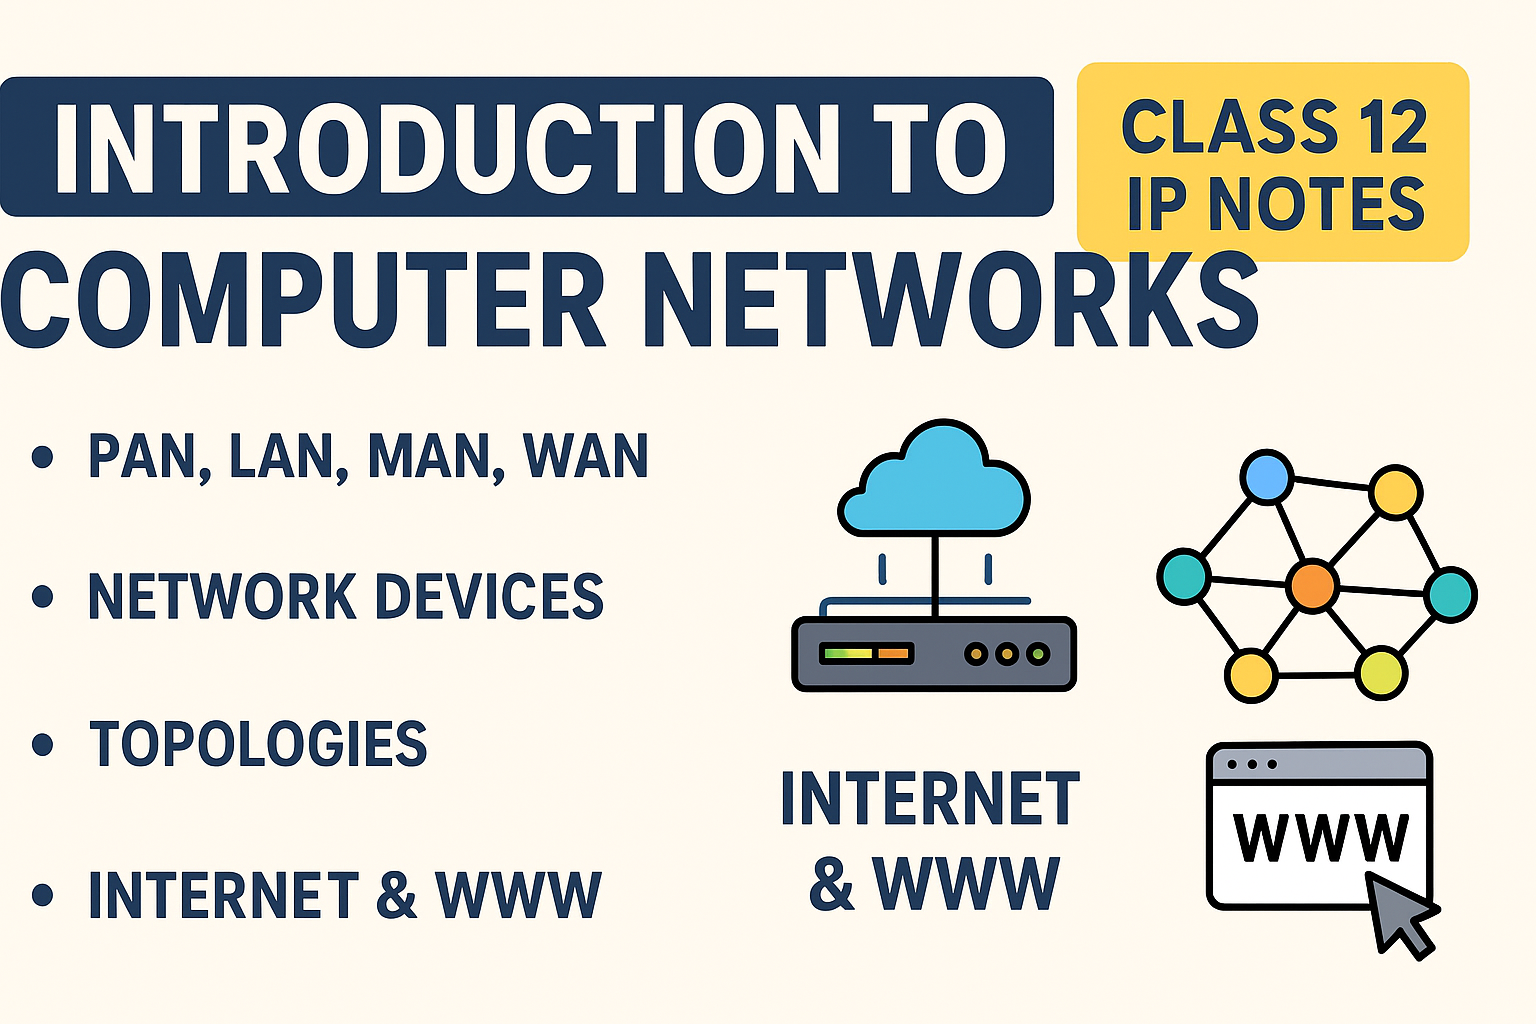
1. Introduction to Networks 2. Types of Networks 3. Network Devices 4. Network Topologies...

When students enter their 12th grade in the Central Board of Secondary Education (CBSE)...
Working with date and time is a crucial aspect of database management, and MySQL...
Master MySQL string functions with this comprehensive guide! Learn how to manipulate and handle...
Python programming is a key part of the Computer Science curriculum for CBSE Class...
MySQL is an essential part of the Class 11th and 12th CBSE Computer Science...
Python, as a versatile programming language, offers a variety of collection types to store...

Data visualization is an integral part of data analysis, and for CBSE Class 12...
If you’re a Class 12 student pursuing Information Practices (IP) under the CBSE curriculum,...

Objective: To analyze and visualize COVID-19 statistics such as confirmed cases, recoveries, and deaths...
Are you a CBSE Class 12th IP student looking for an interesting project that...

In this project, we will create a Personal Diary Application using Python, allowing users...

In this project, we will create a Quiz Game using Python. The game will...
In this project, we will create an E-commerce Management System using Python, allowing basic...
In this project, we’ll create a Weather Forecasting Application using Python. The app will...
This project involves creating an Expense Tracker Application using Python, where users can log...
This project will involve creating an Online Exam System where students can log in,...
This project involves building a Hospital Management System using Python, Tkinter for the GUI,...
In this project, we will create a Library Management System that helps manage book...
Here’s a basic outline for creating a “Student Management System” using Python. This project...
These projects involve Python fundamentals, database connectivity (like SQLite or MySQL), and GUI design...

The CBSE Class 12 Informatics Practices (IP) viva plays a crucial role in assessing...